In the eight-plus years I’ve been writing this blog, I’ve remembered a lot of little details. I’ve also forgotten just as many. Such was the case Thursday, when a John Shea article brought up San Jose’s economic impact report from 2009 (Exhibit 3 in the antitrust case filing). Shea asked whether a move to San Jose would boost attendance. He then pointed to the report’s assumption of only 2.1 million in annual attendance at a hypothetical 32,000-seat ballpark.
A’s superfan, radio gadfly and occasional commenter here (and friend of the blog) Bleacher Dave stepped up to push the idea that San Jose has an attendance problem, even though an Athletics game has never been hosted there. I rebutted that the attendance claims were never meant to forecast actual demand, only to provide a baseline for tax benefits (conservatively) and indirect benefits (usually outrageous). No matter, Dave pressed on, citing study author CSL’s experience in the field to buttress his argument.
@jeffaugust @dandibley @MarkKreidler @whiteygleason @JohnSheaHey consider the whole report. #AnInconvenientTruthSJ pic.twitter.com/AqQqo67pc9
— Bleacherdave (@Bleacherdave) June 28, 2013
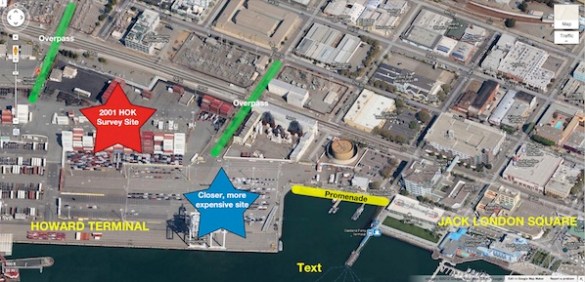
CSL also did similar reports for the 49ers and Raiders to back those teams’ respective stadium campaigns. So far, only the 49ers have their stadium going. I pointed Dave to the Raiders report. Later I remembered that Let’s Go Oakland did its own report for a hypothetical Oakland ballpark either at the Coliseum or somewhere in the Jack London Square area.
Funny thing. Gruen Gruen & Associates, the firm hired to do LGO’s study, made its own attendance assumptions for a new ballpark:
- Coliseum: 2.11 million/year
- Jack London Square: 2.24 million/year
The key difference is that LGO’s study has a ballpark capacity of 36,000 instead of San Jose’s 32,000, which would in theory allow for larger sellout crowds when sellouts occur. The projections put the Coliseum roughly on par with San Jose and JLS ahead of both to the tune of 1,600 fans per game. If San Jose’s capacity were greater and had a similar number of sellouts, San Jose would land somewhere in the middle of the Coliseum and JLS projections.
Now if I wanted to twist these numbers into something they aren’t, I’d say that there’s something definitely wrong with the supposedly rabid Oakland fanbase only increasing attendance over the old Coliseum years by 7-13%. Surely there’d be a better response than that, right?
But I won’t. Because that’s not what these studies are for. The studies base their assumptions on five-year historical ticket sales at the Coliseum, which as we all know isn’t exactly an attractive, modern venue. Only one of those years was a playoff year. A major rebuilding plan marked the following years, which negatively affected ticket sales and fan interest. Wherever the A’s build, they won’t have the luxury of getting a big public subsidy as was the case in Miami or Washington, DC. If this thing actually gets built, it’s reasonable to expect that there will be so much pent-up desire to be there (the wildcard of on-field performance notwithstanding) that attendance should easily surpass those assumptions. It all has to do with season ticket sales.
Before a single pile is driven or brick is laid, the A’s will probably have to get somewhere in the neighborhood of 15,000 season ticket commitments or FSEs (full season equivalents). The closer to 20,000, the better (the A’s hover below 10k currently last I heard). The Giants maintain 25-27,000 FSEs annually, and they were so confident in the demand when their park opened that they only offered full season ticket subscriptions. (Note: More upfront ST commitments – especially multiyear – also proves to banks that the project is worth financing.)
The greater the ST sales, the better for the whole A’s market. It creates scarcity for the remaining seats, it provides a solid secondary market, and if pricing tiers are set correctly, should create good value for fans at multiple levels. It also means a lot fewer really cheap seats, but that’s the price of growing into a better, privately funded facility.
The two economic impact reports written for San Jose and Oakland provided none of this context and took none of these factors into account. All they did was average attendance over a short window, bump it initially upon opening, and taper it down over time as the honeymoon effect wore off. That’s the most basic of analysis and should be treated as such. Actual numbers should be better, but could also be worse if prices are too high or the team is pitiful. There are no guarantees.
If the goal of certain individuals is to create a gotcha moment out of a misinterpreted number, then we’re going to waste a lot of time finding gotcha numbers and moments everywhere. It smacks of a political race. There are much more important numbers to consider, such as the cost of Howard Terminal or a territorial rights payoff. Those are the numbers that matter. Not some previously ignored projections from several years old documents that are easily disregarded.
If people want to persist with stuff like this, I can’t stop them. We’ll be here as we always have, ready to provide the nuance that the news articles, tweets, and radio callers often lack.
—–
P.S. – Oakland Fan Pledge, which was started to prove fan commitment to the A’s, has just over 4,000 pledges so far (including mine). We’ve got a long way to go, folks.
P.P.S. – One more thing to consider. The Giants have long maintained that they need attendance of 30,000 every game in order to take care of AT&T Park’s debt service and field a competitive roster. How on earth would the A’s be able to pay for a more expensive park with 25,000 a game, even if prices were jacked up?


